

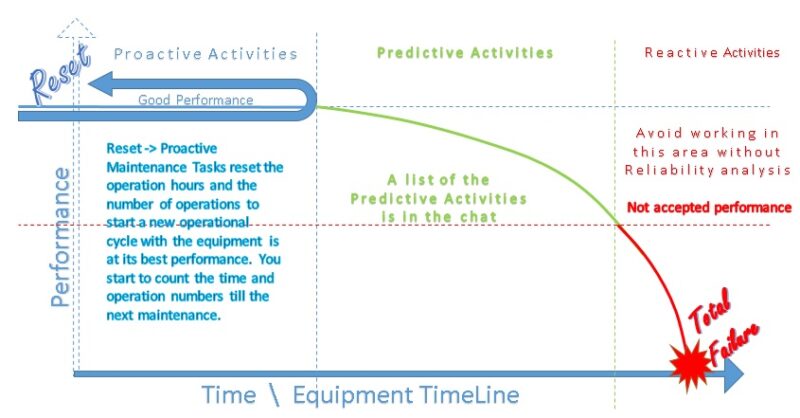
What’s better than an easy visualization tool that will help you understand the overview of each maintenance task. When you spot the activities applied to any equipment, system or facility on the P-F curve, you can easily know what type of tasks are you doing now. Maintenance tasks in general are classified into:
- Proactive
- Predictive
- Reactive
We can consider those types of activities as three phases on the time line of the equipment.
Proactive Tasks
A Proactive task, is a maintenance task done before “the fact”. In other words, before any probable failure is initiated. Many types of tasks are related to the proactive period of the equipment lifetime. That’s when the performance of the equipment is stable at good performance levels. Examples are:
- Maintenance based on Number of operations, Operation Hours or Calendar based maintenance activities including:
- Replacement
- Inspection
- Lubrication
- Calibration
- Precision (as Alignment)
- Preparation Activities:
- Training
- Procedure Preparation
- RCM analysis (RCA\FMEA) – RCM->Reliability Centered Maintenance analysis including the RCA -> Root Cause Analysis and FMEA -> Failure Mode Effects Analysis
- TPM 5S as Housekeeping – TPM -> Total Productive Maintenance
- Measurement Metrics (KPIs) – KPI ->Key Performance Indicator
- Suppliers and service providers qualification
The flat region of the Equipment condition curve or P-F curve before any probable failure occurs is where you can perform all these tasks. Anyhow some of these activities, when exceed its cycle, their execution is after a potential failure initiation. Actually if you don’t use any predictive equipment, you won’t be able to decide if this is the case or no.
Example if a ball bearing change is performed based on a calendar cycle. May be it is already in the potential failure region if there is no predictive measure used. Anyhow, the bearing will be replaced. The problem lays if the exceeded cycle was for the bearing lubrication. If the Proactive limit exceeded and a potential failure is initiated, this may lead to a premature failure in the bearing. So, do not exceed the cycle of the calendar base activities without a supporting Predictive tool. That’s the aim of Predictive tasks.
The predictive region
So again, using predictive tools will help to reduce the maintenance cost in two ways:
- Increase the time between maintenance activities reducing the average parts usage and the equipment planned stoppage increasing the availability
- Minimize unplanned activities or failures. This will eliminate a good portion of production losses either from material or operation rate by providing stable operation
It is the region after a potential failure is initiated so it can be detected with a predictive measurement tool. The prediction technique is based on the comparison with standard values or previous values. Standard values are the recommendations of :
- the supplier
- manufacturer
- subject matter experts
- the supplier of the predictive equipment or system
- the recommendation of the expert system purchased
Previous values are the values of previous measurement of the same equipment or similar equipment. The values measured after maintenance or at equipment initial installations are considered “foot-prints” to compare with. Some predictive equipment recommends a margin for change after which it signals a low or high alarm. Example in the ultrasound measurement, an increase of 4 db above the standard is a low alarm and 8 db is a high alarm except for VFD'(Variable Frequency Drives)s and Low speed equipment.
Predictive measurement tools
The predictive measurement tools are arranged based on their sensitivity from the most sensitive to the lowest as:
- Ultrasonic
- Vibration
- Oil Analysis
- Wear testing
- Thermography
- NDT, as inspection for measurement recording
- Preinstalled field sensors of flow, level and temperature
- Usually those sensors are installed to monitor the process
- So, they have their own cycle of reading change in synchronization with the production process
- We need to catch the change in the trend of the normal operation cycle. You can realize it when the temperatures of the loading and unloading cycle increase by a certain number than a day or a week ago.
When there is a prediction system in place, you can extend the previously blindly scheduled repair activity beyond the steady state operation to the Predictive tasks region of the P-F curve, you decrease the maintenance costs as described above. At the same time before the failure region starts where rapid degradation occurs faster than the possibility to catch it.
Preinstalled field sensors
The preinstalled field sensors are not usually considered as a predictive equipment and many teams wait for an alarm to consider taking an action. However, those sensors are free-of-charge installed predictive sensors for maintenance. Their main target is to monitor the process. They could be of extreme value for equipment condition prediction specially if they are producing an analogue value that is displayed as a graphical trend.
In many situations those analogue values are in the PLC (Programmable Logic Controller) for sake of comparison to alarm and trip limits or they are locally displayed if the alarm nd trip are generated from a field sensor that displays the value but send only a digital contact for alarm or trip. With the digital era we are living, it is easy to transfer those signals to a graphical trend in the maintenance room. Comparing them from day to day can generate a wealth of information and understanding for the equipment performance and fault initiation.
Example:
Usually a pump delivery pressure and flow are monitored either locally or on a SCADA system in the operators room. The normally operation values are far different from the alarm and trip values. They change with the process between loading and unloading conditions. The loading unloading curve of one pump can be between 40 and 100 bar. A second or standby pump on the same system can show a 40 to 90 bar change between loading and unloading. If the load is the same at both recorded curves, that’s an indication that the second pump is not able to deliver 100 bar. Also, if the loading pressure at same load condition is increased to 110 bar, that’s an indication of an increased resistance in the system. Even both cases are not within the alarm limit, they signals an action of inspection or close monitor to avoid a probable failure.
Static and Electrical systems
Think of those systems that doesn’t have a direct feedback of their status like valves, pipes, electrical power connections and components and some PCB’s (Printed Circuit boards). They are there performing their function, there is no life time or standard maintenance replacement cycle. The only possible maintenance activities are visual inspection and retighten.
Most of the time those activities are difficult to access and they needs the unit shutdown. Those units shutdown, isolation and preparing access have long cycle in order of months up to years. During the shutdown, the equipment is cold and not under the operation stress, so you are inspecting it in the wrong context. The cost of such failures are usually high in terms of stoppage time, equipment cost and cascaded probable failures. That’s where the beauty of prediction equipment as Infrared thermography and ultra sound scan appears. While the equipment is in its normal operation and while you are at a safe distance, you can capture the probable failure, estimate its degree and plan a spot action based on that.
Reactive region of the P-F curve
When you realize during inspection an abnormal audible sound or temperature change without the use of a tool, that’s a failure. It extends till smell appears then the equipment fails so quickly that you can’t prepare an action. Now you need the unplanned maintenance to correct the failure. Why preventing the failure is important? To prevent its consequence of lost production, cascaded or induced failures, unsafe operation and unpreparedness.
You can read more about that in those two posts linked below:
In Conclusion,
All Maintenance tasks targets maintaining the equipment to perform all their functions. Those tasks are classified into proactive, Predictive and reactive or corrective. You can easily spot your activity on the P-F curve to know which type of tasks are you performing. The Predictive maintenance balances both of the maintenance cost and the failure cost. This visual easy tools let you think of your next step to improve your maintenance performance. Enjoy your coffee whether it is a latte or a macchiato, it is a bless.
If you feel you need help with any of these ideas we discussed, request a Management Consultancy or Coaching Services From our Store


One Comment