It is important in this chat to explore the maintenance team productivity. There are many folds for this “Maintenance Productivity” title. The first one will be the overall Maintenance process productivity. Then comes the subgroups productivity and lastly is the personal or individual team members productivity. The easiest one to calculate is the subgroups productivity. Why? Because you analyze the subgroups productivity on a clear requested output bases. More details about subgroups are below.
The individual team members are more difficult to calculate their productivity. This applies to everyone of us whether you are the supervisor or the supervised but we shall defer it to a separate coming chat.
he most difficult one to calculate is the maintenance process productivity. Why? Because of the difficulty to consolidate a meaningful physical output. Let us delve deep in the subgroups and maintenance process productivity
Subgroups productivity
First, why we may need subgroups? Mainly for focus, accountability, and effective communication. Subgroups can have drawbacks of isolation, conflicts and asynchronization with the team. The planning team, supervisors and management have the responsibility of diminishing those drawbacks by needful coordination, synchronization and communication. What about splitting the team into individuals? It might not work as the isolation will increase and less cooperation will be available in the workplace. Unless, every one is producing a distinct irrelated output. Anyhow, more subgroups calls for more coordination effort.
It is easier to calculate is the subgroups productivity if you analyze it based on a clear requested outputs. In other words, you give them a number of tasks to execute within a certain time span. You can pin-point the correctly executed tasks, their time of execution and other parameters. Then you can calculate this in relative to the requested tasks and you get a percentage of 100% or less.
A good example for this group can be the planning group. While other groups performance is based on how you distribute the tasks within your team. They have clear requested outputs to fulfil clearly requested tasks. Realize how the two -clear- adjectives are clearly related. The clear inputs of the subgroup are the number of tasks, manhours of the team members, the due dates and the complexity of the tasks. The scale against which you measure the complexity of the tasks need to be clear and comprehensive.
There is an important notice. If you have autonomous groups ……
There was a great briefing about the pros and cons of autonomy in the below paragraphs which I found in an article about an experiment that correlates autonomy and productivity. You can find the complete experiment here.
Autonomy for individuals as well as in teams increases ownership of outcomes and improves performance (Cordery et al., 2010; Zak, 2017b). Employees who have a high locus of control are able raise questions without adverse consequences and thereby improve output quality (Long, 2012). Hogan and Coote (2014) present evidence that innovation is higher when employees have autonomy due to greater persistence in overcoming problems for projects they control. Ceding control to employees is often feared by managers because it reduces the ease to monitor the employees. Consequently in their perception, this may increase the opportunity for shirking (Spencer, 2003; Arocena et al., 2010). However, when autonomy exists in an environment of organizational trust and combined with intrinsic motivation, employees exert discretionary effort rather than shirking (Thomas, 1990; Spencer, 2003; Zak, 2017b).
The experiment showed that the productivity at work improves the well-being . This is due in part to improved positive mood that comes from satisfying work. A study of 12,000 employee diary entries showed that 76% of people’s best-mood days occurred when they were productive . Employees working in organizations that have a culture of trust, which includes high locus of control for employees, report happier than do employees low-trust organizations (Zak, 2017a, b).
If you have autonomous groups, you should place great emphasizes on the streamlining of the process of sending requests and receiving feedback and outputs. In our coming training on Udemy we shall show you how to create and customize your own tracking sheets that perfectly fit for following up autonomous groups
Maintenance process productivity
As we defined productivity before in this chat: The secret ingredient to understand productivity, it is an output divided by an input. To calculate the productivity of any process, we need to know its output and its input. Optimally, if we managed to convert all the inputs to the same unit example “Dollars i.e. USD” it would be possible to consolidate all the inputs of the process into one number. However this is not the target of all the productivity calculations. Some productivity figures uses specific inputs as spare parts cost or number of direct and indirect labor. This opens the door for a new term which is partial productivity calculation.
Examples of the inputs to the maintenance process :
- The maintenance team hours i.e. regular and overtime hours.
- The cost of spares
- The stoppage time for corrective or preventive maintenance
- Scheduled maintenance time or number of tasks
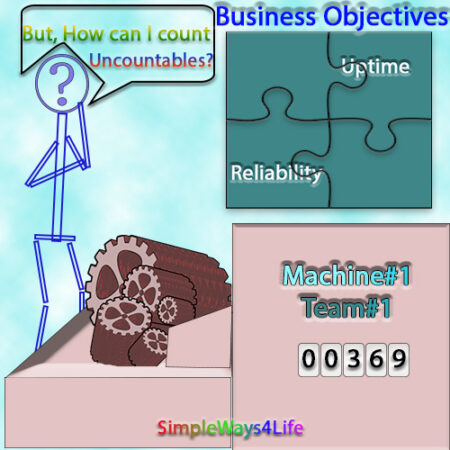
However, the difficult part is to consolidate a clear countable physical output of the maintenance process. The maintenance process has two main targets. The first one is to maximize the uptime i.e. the time available for production. The second one is to maintain the original or at least the performance of the equipment needed by the operators to produce with a the planned rate and quality.
In order to improve productivity we need to measure it first. Second we need to make sure that the inputs to the equation are solely attributable to maintenance. Then, to improve productivity means to increase the output by more than any increase in inputs, or reduces the amount of inputs needed to produce the same amount of output.
What output can reflect the maintenance process performance?
When we relate to an output, it is an output that is measurable, countable and is required. The output from the production is clear and countable. Even in the production support, raw material supply and sales, you have numbers of output that you can measure. Moreover, this output is directly required from this team. However the target required from the maintenance is not directly neither abstractly measured. The uptime of the equipment is the maintenance main target together with the minimum cost of maintaining this uptime and good condition of the equipment. However if you want to use these figures to calculate the maintenance team productivity, what you will place in the equation as input and output?
For output, you can use the uptime in general as an output or the MTBF (Mean Time between failure), or the MTTR( Mean Time to repair) or any other measurable metrices of the maintenance team. We might think of the number of maintenance tasks. But is it required from the team to do more maintenance tasks? This will negatively affect the uptime and the cost.
Using any of these indicators of the maintenance process in the productivity calculation would produce a partial indicator. There is an important notice if you want to combine some of these measures after converting them to a unified monetization unit; Take care of the improvement direction of these figures. Does it increase when it improves as the uptime and MTBF, or decrease as MTTR and Unscheduled repair time?
Anyhow this was a brainstorming session around the maintenance productivity. It targets only giving insights about popular terms in the business, and how to apply them to maintenance.
In Conclusion,
This was a brainstorming session around the maintenance productivity. It targets giving insights about popular terms in the business, and how to apply them to maintenance. We had explored the different folds of the maintenance productivity for the maintenance subgroups and the maintenance process in general.
What a bless coffee is, even in your imagination. Enjoy it while reading our chats.