

It is simple, just record what are you doing NOW. Whatever you are doing NOW is a great starting point even if you are repairing it when it fails. It is one of the Maintenance Strategies that is valid and you can simply reach it from a detailed Reliability analysis. Technically is called Corrective Maintenance. It is concluded from the Reliability analysis of the equipment or sub equipment when there is no technically feasible or worth doing action. So, if you intended to start a Maintenance system, start now your first step by simply recording what you are doing now but, give it the correct technical label as Corrective Maintenance (Repair it when it fails)or Time based or condition based Preventive maintenance. Preventive action is an action taken before failure to prevent the occurrence of failure.
Second Step, Record Data
The initial step was to record what you are doing now and to give it technically correct labels. Then second step is to record a feedback on every time you do this action. This feedback to be beneficial it need to be some how readable and conveying some numerical data. Examples of this numerical data can be:
- Time taken to repair the equipment
- Manpower needed
- Manpower cost whether internally (Wage/hour X Working hours) or contracted manpower cost
- Parts cost if any
- Effect on Production in hours or minutes
- Any safety or environment violations caused by the failure or the maintenance like oil or dust waste or electrical shock or burns due to heat.
Third Step, Review data
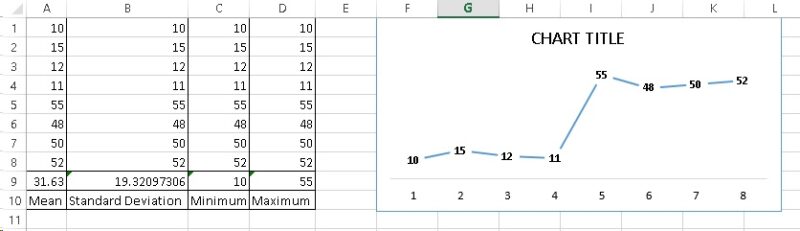
Usually for any data to be beneficial, record it over time to remove the bias of abnormal conditions and wrong recording. It is easily to notice the wide variation between the recorded numbers if it exists. Example when repair time ranges between 10 min and 55 min for same failure and same action. That’s an eye opener that there is something that needs attention about the data. For small set of numbers, you can go through manually. For bigger set of data you need to rely on some statistical figures like the Mean (The normal Average), Standard Deviation (Which Shows the variation of the data), minimum and maximum values. All these are statistical basic functions in Excel and Google Sheets as in below Figure:
Start to ask questions like 5-Whys?
You repeat asking Why Five times. This will take you 5 steps deeper into the reason why this variation of data happened. This step is crucial before Step 4, which is creating Key performance indicators then analyzing the results to select where to focus your efforts and attention.
This variation can come from many reasons among them:
- Same error appears but failure is different. It was a faulty sensor then a leaking seal. But record still show same failure
- Production added covers that delays repair
- Pressure sensor setting was raised not to get alarm, so seal started to damage
- One technician was moved to another area and the new one in charge is taking longer time as he inherited wrong procedure
Step 3-2, Avoid the bias of the first impression
There are some first impressions about the data that might be attractive to take action. Those attractive data might be deceiving at sometimes and might worth an immediate action. Example of those deceiving first impression data:
- It took 3 days to repair the equipment. True, but the production continued as there are one or two standby units
- The repair cost was 1000 USD. True, but the machine cost is 10 Million Dollar
- There are no spare parts at the store and we need to purchase the parts then start the repair. True but, that’s the company policy. It can be reviewed if proven by numbers that some spares need to be kept at store.
- The repair needs an outsourced specialized team of the manufacturer and they arrive within 48 hrs from the maintenance call. True but, there is no one from the maintenance team has the skills for this activity. Moreover, contractually it should be done by the supplier in order to maintain warranty.
Examples of the data that invokes immediate action:
- Production stopped for unplanned 3 hours and we missed the monthly plan
- This leakage causes slippage and one technician sprained his ankle.
- This failure occurs 5 times a day
Why raw data is as important as trends and indicators?
Reading trends and flaws in the raw data will help to correct the source data. For any system even it is a manual one, Rubbish IN = Rubbish OUT. This means that you can’t rely on the data analysis results or indicators if it is not conveying the real field situation. Another vital point, It is normal that data analysis and trends are calculated within a time frame. This will normalize the abnormal instances recorded in the data. It can be good to balance a single mistake that occurred, if we were conscious about it and had taken the necessary measure so it won’t occur again.
However, if it was hidden within the bigger data set and no corrective action is taken, it will repeat again till a significant change in the indicator occurs. Changes in the indicators will set an alarm red flag on the dashboard. That is very helpful if we missed the sprouting of this flaw in the first place. In case you don’t record data, read it and improve its collection, you are in a haphazard maintenance environment where every failure needs a superman.
Now you can see the interval at which an equipment fails. This serves getting prepared for this failure in many ways: Prepare spares, prepare maintenance manpower, prepare standby. Then Change it before it fails. Do this in a scheduled stoppage and, you had taken your Maintenance system to the next level
A Probable Source of Data variations
Examples that may cause chaos in data when there is too much variation between maintenance teams in the recorded repair time or in the rework frequency. This information can stimulate recording who did the maintenance in each time. Then knowledge gaps in the maintenance teams are clear. Rectify them using internal training, knowledge transfer or preparing a unified maintenance procedure that everyone follows
Fourth Step, Create indicators that will give you quick pointers
Key performance indicators are numbers that gives a cumulative indicator of performance of a certain function. There are a lot of indicators out there and you can generate your own set of indicators or tune the existing one. The target is to have meaningful numbers that points out if your maintenance team is performing as expected or less or better. The intention behind this quick indicators is not to blame or claim but to shed the light over an opportunity for improvement. We shall summarize below some of the popular Key Performance indicators and how to use them. You can find different interpretation on different websites. Some of the data here is from SMRP – Society of Maintenance and Reliability Professionals-.
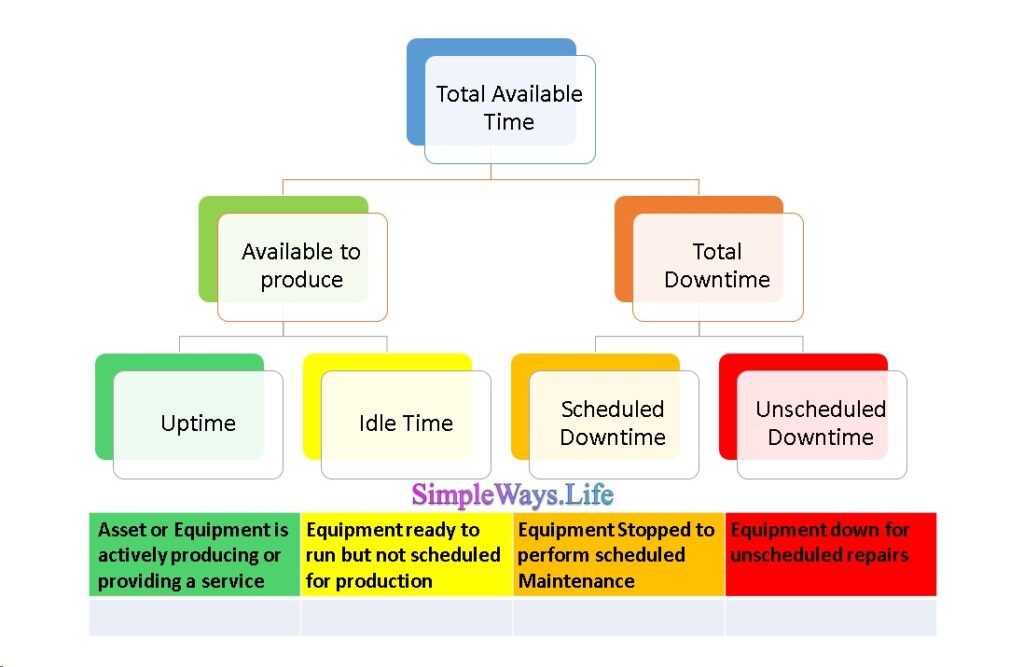
First point to set are the definitions of the Equipment timeline. Below Figure shows a recommendation that need agreement from all parties involved in the plant operation and maintenance. Examples of the confusing point are: Power outage are classified as Idle Time, Unscheduled Downtime or subtracted from the Total Available time. Same applies for Raw Material Shortage and equipment upgrade. There are no right or wrong classifications. Simply it needs agreement by all parties. Then, document it and solely use it as the base of the calculations.
Examples of Simple Key Performance Indicators KPIs
General Guidance:
- The time base of Total Available time will depend on your specific model of operation. If It was agreed to use the weekly work schedule, then the base will be 24X7=144hrs. If the monthly base is selected, then use 24X30 = 720 hrs.
- The time base need to be realistic i.e. if the plant operates for 12 hours a day then the base will 12 hrs not 24 hrs. If the scheduled maintenance has a separate night shift and operation is only in the morning or day shift, the each one has a separate base.
- Similarly if maintenance is during the weekend while operation is during the weekdays. It need to be clear that the scheduled maintenance is not cut from the available time of production and is calculated separately.
- On the other hand, unscheduled maintenance is always related to making the equipment unavailable for operation during the time it is scheduled for operation. Not the additional tasks on the scheduled maintenance time.
- Anyhow, once you set written bases for the data it is always possible to change the agreement but never compare results obtained based on different calculation bases.
Unscheduled Downtime:
This metric is the amount of time an asset is not capable of running due to unscheduled repairs (e.g., repairs not on the final maintenance schedule).
Unscheduled Downtime = Algebraic Sum of Asset Downtime in hours or minutes Not Identified on the Weekly Schedule.
Percentage Unscheduled Downtime:
This is a made up KPI. After calculating the unscheduled Downtime you can select a comparison base. Then, calculate the ratio of the unscheduled downtime relative to this base. This base can be Available time, total available time, total downtime, etc.
Percentage Unscheduled Downtime = 100 X (Algebraic Sum of Asset Downtime in hours or minutes Not Identified on the Weekly Schedule.) / (Selected Bases)
Maintenance cost:
This value is better calculated through the accountant or finance team. Just make sure that you know the bases of calculation. It need to include all the parts, liquids, labor and contractor costs.The real value of this metric appears over long periods of time as the maintenance cycles can be different from the monthly cost calculations. SO, some months will have higher maintenance cost specially in parts and overtime than other months.
It is useful to compare it to last year value or an agreed budget.
Mean Downtime:
This is the average downtime required to restore an asset or component to its full operational capabilities.
Mean Downtime (MDT) = Total Downtime (hours) / Number of Downtime Events
This value is great for trending to see if it decreases with time. Also, it is useful as a datum for comparison with every similar failure.
Mean Time between Failures:
This metric is the average length of operating time between failures for an asset or component.
Mean Time Between Failures = Operating time (hours) / Number of Failures
In Conclusion,
You can start a Maintenance System at any time immediately when you start to record what you do. Then collect some numerical data as Repair time and cost. Verify these data over some time. And create some indicators to alert you if something goes out of track..
If you think about documentation see some of our previous posts about it:
Maintenance 101 : Documentation – 1
Maintenance 101 : Documentation – 2, checklists
While thinking of your maintenance system enjoy your sip of coffee it is a bless.
If you feel you need help with any of these ideas we discussed, request a Management Consultancy or Coaching Services From our Store


One Comment