

Why we collect data? The first hand answer is to make informative decisions. That’s correct but too much broad that we can put it into action. So after we had prepared our cups of coffee let us discuss how to make use of the data we have at hand.
First things First, Do we collect Data or Information?
Data are pieces of information collected with the intention of further processing as defined by most dictionaries and as the perception we all have. At Merriam Webster Data is defined as: “factual information (such as measurements or statistics) used as a basis for reasoning, discussion, or calculation”. On the other hand Information is defined as “facts about a situation, person, event, etc“. So what we collect from field is Information because they are facts about the status of the equipment. It remains information just to inform you of a fact till you decide to added to other pieces of information collected and then analyze this data to conclude a result. So a failure notice is an information but, when it is combined with other failures information they are a data set that can be used to derive some indicators as MTBF (Mean time between failures)or failure root cause.
So, we shall be using information or data interchangeably and the meaning will be given by your intentions.
Intentions behind collecting the information
The intention makes anything comes true. Why? Because when you have an intention behind doing anything, you have an imagination of how the end result would like like. The end result may come totally different from what you expected or planned at the beginning. That’s still not bad as it will invoke a brain storming about the data, how it was processed, the status of the equipment. or anything in life you hold an intention behind doing it. So let us explain it in a simpler manner.
As we discussed before you may apply the Maintenance System Approach (MS-APR) discussed here to any size or scale of business. Some older business units might have a data collection system in place. However, with time, the intentions behind collecting these data are lost and it turned into a systemic process that no one pays attention to its output. The funny about this situation is that after a failure, when they return to the records, they can see an evidence of an alarming deviation in data.
Though, no one paid attention to it because the target had shifted with time to collect and record information not to get a useful indications out of it. One of the nice comments I heard from a lecturer in a webinar from SMRP (Society of Maintenance and Reliability Professionals). Though EAM (Enterprise Asset Management) system was in place and it generates work orders and add it to the backlog and every group was having a terminal to the system, it was a must to send repeated emails to each one about the approaching work orders so they won’t overlook it.
Keep in mind, having a system in place is nothing without anticipating and making use of the helpful conclusions and alerts it will send you.
Examples for some useful intentions:
- Maintain equipment operation satisfactory (Reliability)
- Minimize Maintenance cost
- Identify high risk equipment
- Provide Indicators
- Find chances for Improvement
Maintain equipment operation satisfactory (Reliability)
We had a complete chat around how to monitor if the equipment maintenance: More on the importance of Maintenance Added Value through tracking the OEE (Overall Equipment Efficiency). The Complete ideas of Reliable equipment and how to reach there will be the subject of a complete training course. However today we shall look at how maintenance can perceive a satisfactory performance. Satisfaction is a mix of solid results and perceptions.
So beside the importance of the results of the maintenance, we need to emphasize the helpful, collaborative, effective and, professional perceptions of the maintenance word. Those positive perceptions of the maintenance elevates mutual trust and respect. Those emotions fulfills the Social needs in Maslow’s Pyramid. That includes sense of connection and belonging. The internal relations between different groups in the workplace makes all the difference in the healthy growing of the business. This analogy I found extremely sensible when I read this article: Brand Marketing.
This analogy implies that Maintenance is a brand that we need to advocate. Why? Because we have customers. Our ultimate customer is the Profitability or ROI (Return on Investment) which affects all the stack holders of the business. The next customer is the operation team. Followed by the stores, purchase, safety and the queue continues.
Attitude Branding
One of the Brand Marketing Strategies that relates to the Maintenance as a brand is Attitude Branding.
Attitude Branding is the emotional marketing that result in an identity that goes beyond the products.
ExpressTEXT
What synonyms appear in minds when the word Maintenance pops up:
- Unavoidable cost or Added value, It is easily to know which way way you are going by tracking the MTBF (Mean Time Between Failures) if it increases that indicates that maintenance is efficient. In other words. Also, Maintenance cost per unit production and Rework% can also be good indicators. Rework% is the work done on previously maintained equipment that has prematurely failed due to maintenance, operations or material problems.
- Unstable operation or smooth operation, It is easily to know which way way you are going by tracking the MTBF , Rework% and PM%. Preventive Maintenance % is the ratio of hours spent on Preventive Maintenance to the total maintenance hours including failure repair.
- Long unscheduled Delays or Planned and effective intervention. Again trends of MTTR (Mean time to repair) , and PM% can give us a clue of the performance
- Fire Fighters or Maintenance professionals, you can track this perception using PM% . Preventive Maintenance % is the ratio of hours spent on Preventive Maintenance to he total maintenance hours including failure repair.
What’s after deriving the indicators?
Arguments and blaming wont create a positive perceptions of the Maintenance Team. Results and attitude are more reaching and long lasting than words. Those positive perceptions create a mutual trust in the work place that facilitates all activities at the shop floor and has a positive impact on the business.
Maintainers and planners should be open to receive and show respect to all maintenance requests. If there is a solid reason why this job can’t be done now or forever, communicate it politely but firmly. Maintenance team make mistakes as well as others. So we need to sublimate above others mistakes and misunderstanding to find same response back. “We don’t know” followed by a long list of blames to the company, supplier, system, circumstances and many other possible parties would emphasize an everlasting cracked image of the maintenance, kindly avoid it.
Minimize Maintenance cost
To achieve minimum cost you need to know which equipment are consuming the most spares, working hours, overtime and contractor budget. Without data you can only guess which equipment and activities drains your budget. Also, without data and easy analysis we shall focus on the current failure as the biggest problem. Then, we shall shift the label to the next failing equipment and so on. With data you can draw a Pareto Chart as an example for different criteria as the spares consumption per equipment or the overtime per team. From the examples of the Pareto charts below, you can easily point out the 20% of the causes that are consuming 80% of the cost or resources. Targeting the fat cats first will cause fast results that would support the continuity of using the data to derive decisions.
Identify high risk equipment
Depending on your definition for risk, you will set the data that will be analyzed. You may define risk as any failure that affects safety as those related to overhead cranes and slinging wires. You may think of risk as loosing the compliance to national regulations as thoroughgoing excessive dust to the air that violates the environment regulations. It also might be an equipment that causes a chain of induced failures or needs extended production stoppage to repair. All these information are deduced from the recorded and analyzed data. And will help you focus on the real cause of pain.
Provide Indicators
You need a clue of your good performance. This same indicator will generate an alert if performance is drifting down. Examples are cost indicators, MTTR, MTBF, Overtime, OEE and other indicators that need tracking over time using data.
Find chances for Improvement
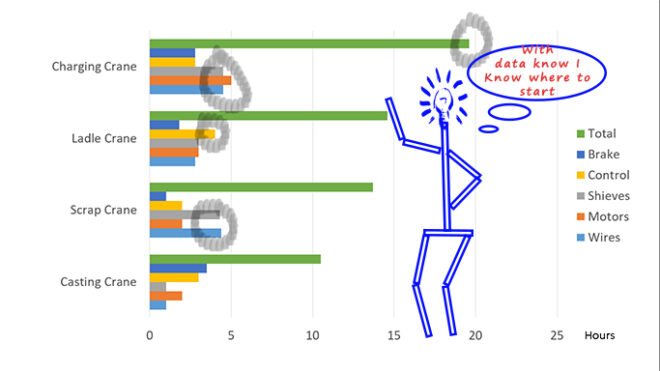
When you touch all the top pains in the previous categories based on data. You can go on a mission to improve the trustfulness of maintenance and its performance. You need data to tell you which area to start with to reflect your improvement. Deep analysis would tell why bearings fail: Wrong storage, wrong lubricant, wrong lubrication, bad installation. Then, you can take a decision of training the lubrication team or changing a supplier. That’s an informative decision for improvement that is supported by data and its effect will appear through continuation of data collection.
In Conclusion,
As we had discussed earlier, data or information are available all the time. To make them useful you need to record them. Then, you need to derive information from these data. The intentions behind collecting the data shapes the gains that will be achieved from analyzing the collected data. You can intend to collect data to improve maintenance performance, equipment operation and safety, reduce cost, or just fill the records. Each intention will sprout its results in the maintenance team day to day activities. Intend to enjoy your coffee, that makes a huge difference.
If you feel you need help with any of these ideas we discussed, request a Management Consultancy or Coaching Services From our Store


2 Comments