The 8 Steps to create an Agile Maintenance – Part 9
Finally we explain how and why we need to reach an Agile Maintenance Process and an Agile Maintenance Team which has an Agile Mentality through the 8 steps needed to reach there.
Finally we explain how and why we need to reach an Agile Maintenance Process and an Agile Maintenance Team which has an Agile Mentality through the 8 steps needed to reach there.
Self-Reform leads to improved effectiveness in our maintenance tasks including improved communication, responsiveness & flexibility and better response to sudden requests while maintaining excellence in every part of the maintenance task. This leads to an Agile Maintenance Process and Team.
A maintenance process that encompasses technical excellence in all of its elements and is reliable will be responsive, flexible and adding a value to its customers and stakeholders. That’s an Agile process.
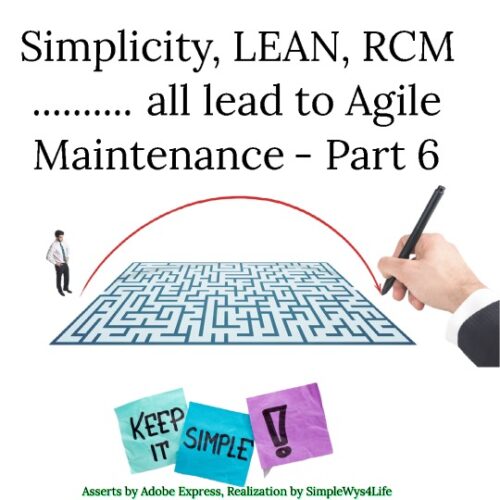
Simplicity of any process leads to agility of this same process. Eliminating or rejecting tasks that are not adding value to the maintenance process would free the precious time and effort of the maintenance team. Hence increasing its simplicity score. How?
A trust-based workplace can solve or at least improve the workplace conditions. However to reach this condition we need to provide the team with what it needs and encourage face-to face respectful communications. This way we can reach to a maintenance team that can make an Agile Maintenance process a reality.
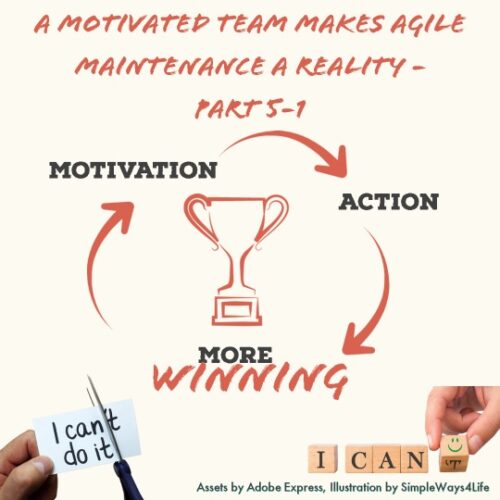
To create and sustain an Agile maintenance we need to build the maintenance process around motivated maintenance teams and individuals. Why? and How? That’s what we had deeply discussed in this article
For maintenance process to be Agile from the perspective of its stakeholders we need to understand stakeholders needs

Traditionally maintenance seemed rigid. However, it is too dynamic. How is that? When you look carefully to maintenance tactics you can see that it embraces change easily. More insights in this article…
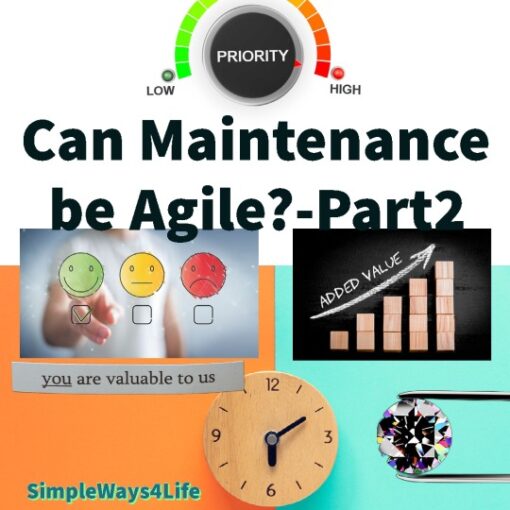
Maintenance tasks easily fits in the Agile first principle by replacing software with maintenance. So now it would be: Our highest priority is to satisfy the customer through early and continuous delivery of valuable Maintenance. Which now perfectly describes the world class maintenance.

Even though we have a plan and milestones in place, we need to closely follow up the few first steps that we take to convert the target into a real world progress. One of the best ways to let our targets touch the ground with wheels running is to look at it from an Agile or Adaptive approach as per PMI definitions and framework.

Steps to follow in case you missed or you are afraid to miss a target. The aim is to fulfil your targets or at least do not miss the next one.

Startup moments in our lives come as an energy boost. But, mastering new reality creation from these new beginnings needs a different mind set.
Mastering a digital skill needs patience to the stumbling start up steps and dedication. The experienced user level of any digital tool can unfold all its potentials and use this tool creatively to unlock new horizons.
come to know Your multitasking Resources. Understand how to use your Competitive advantage but avoid being Burnt Out
Delegation is a skill but to create your own digital delegate that’s not a communication or a interpersonal skill, that’s a digital skill.

Simply, what you want to do? If you want to get more out of a CMMS or ERP systems that…

The golden rule to start building our digital skills toolbox is to look for an easy application or an easy way to learn how to use the application.
There is a wide range of digital skills that we can easily learn and master easily. The very first one is the maintenance dbase. Let’s delve in
We had gone through more than 10 reasons that a make a plan frustrating to the team. And, we had nailed it with some practical solutions.

Why we need to balanced between fixed plans i.e. being systematic and the flexibility of tuning the tasks for the best results?